Bar Charts
Bar Charts in Buildaible provide a simple and effective way to visualize and compare data across categories. Whether you’re analyzing task statuses, sales performance, or resource allocation, Bar Charts allow you to gain actionable insights quickly.
This guide will walk you through the full process of creating and customizing Bar Charts, including advanced settings for axes and series.
-
Access the Reports Page
-
Open the app where you want to create the Bar Chart.
-
In the Left Sidebar, under Views, click “Reports.”
-
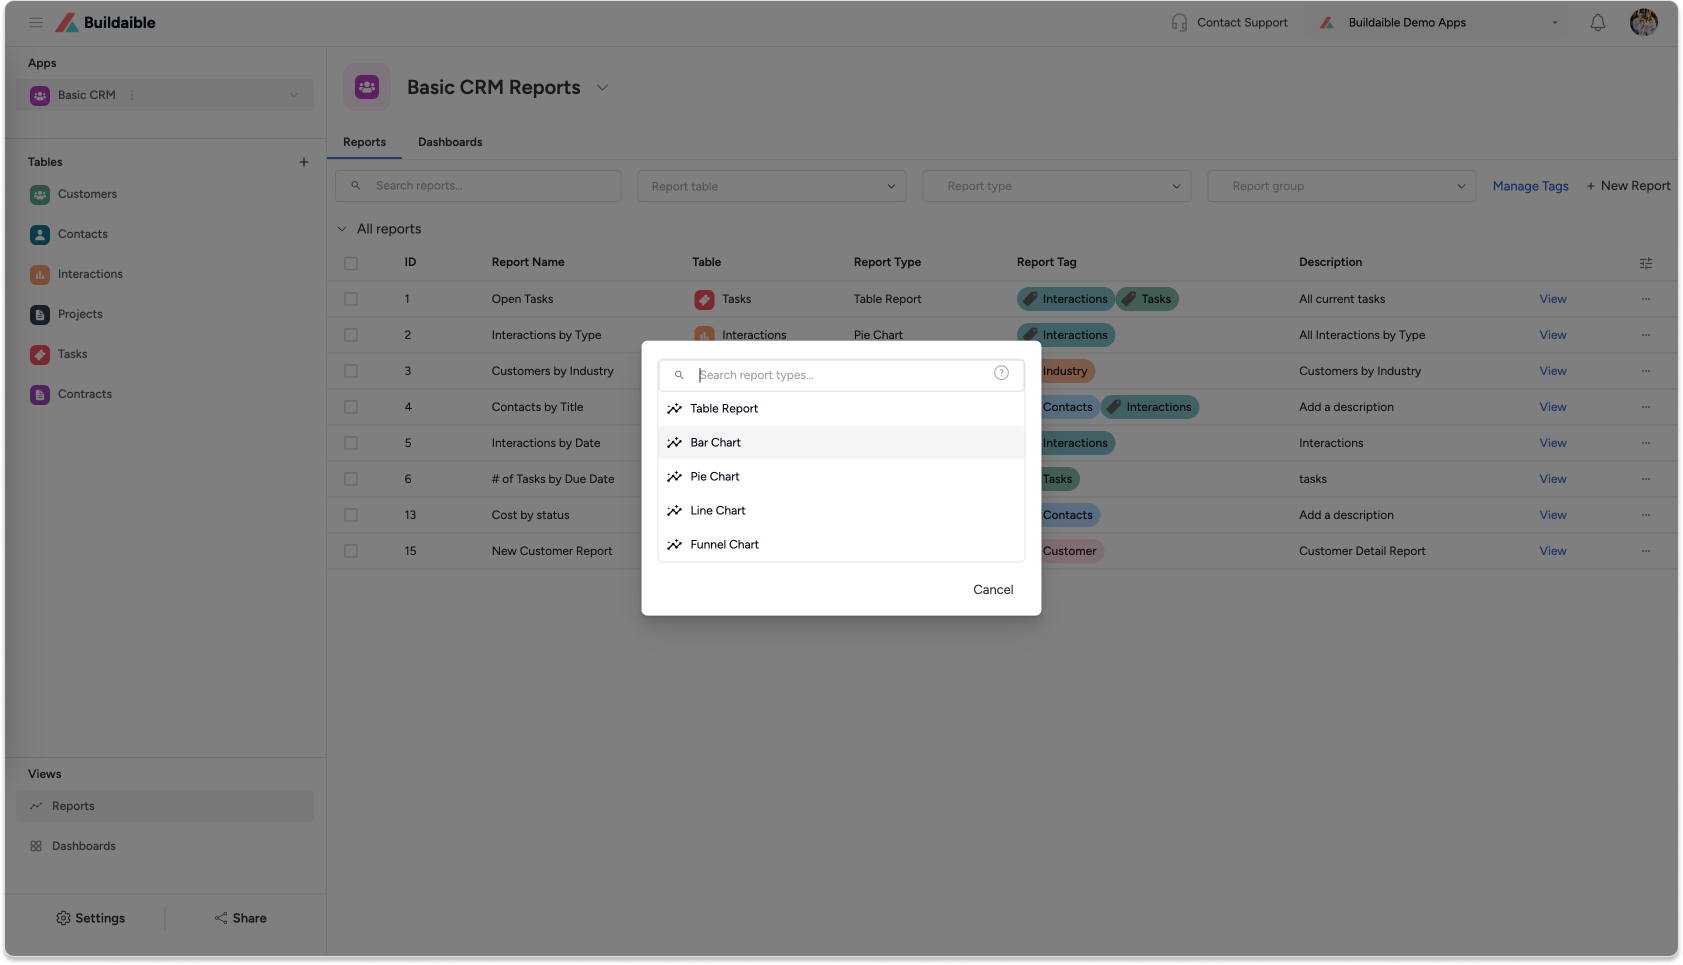
On the Reports page, click the “+ New Report” button.
-
From the report type pop-up, select “Bar Chart” and click Next.
-
-
Configure the Bar Chart Details
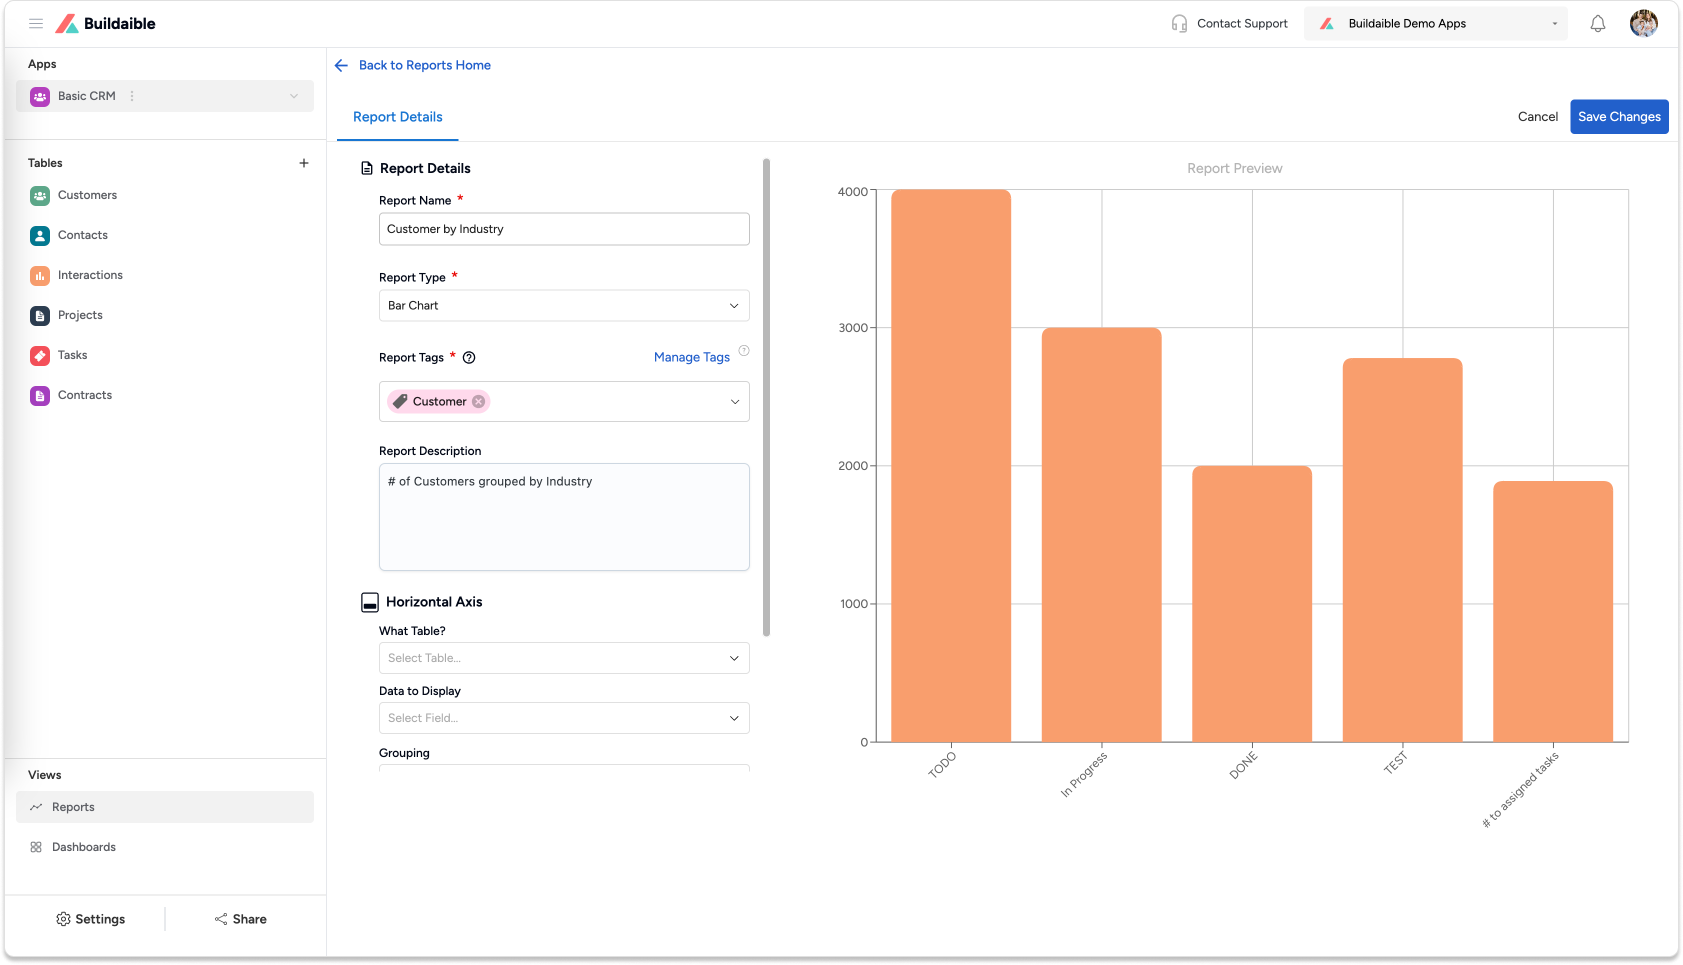
In the Bar Chart Editor, start by adding report details:-
Report Name: Enter a descriptive name for the chart (e.g., “Tasks by Status” or “Sales Overview”).
-
Report Description (optional): Provide context about what the report shows.
-
Report Tags (optional): Use tags to organize and categorize your reports.
-
-
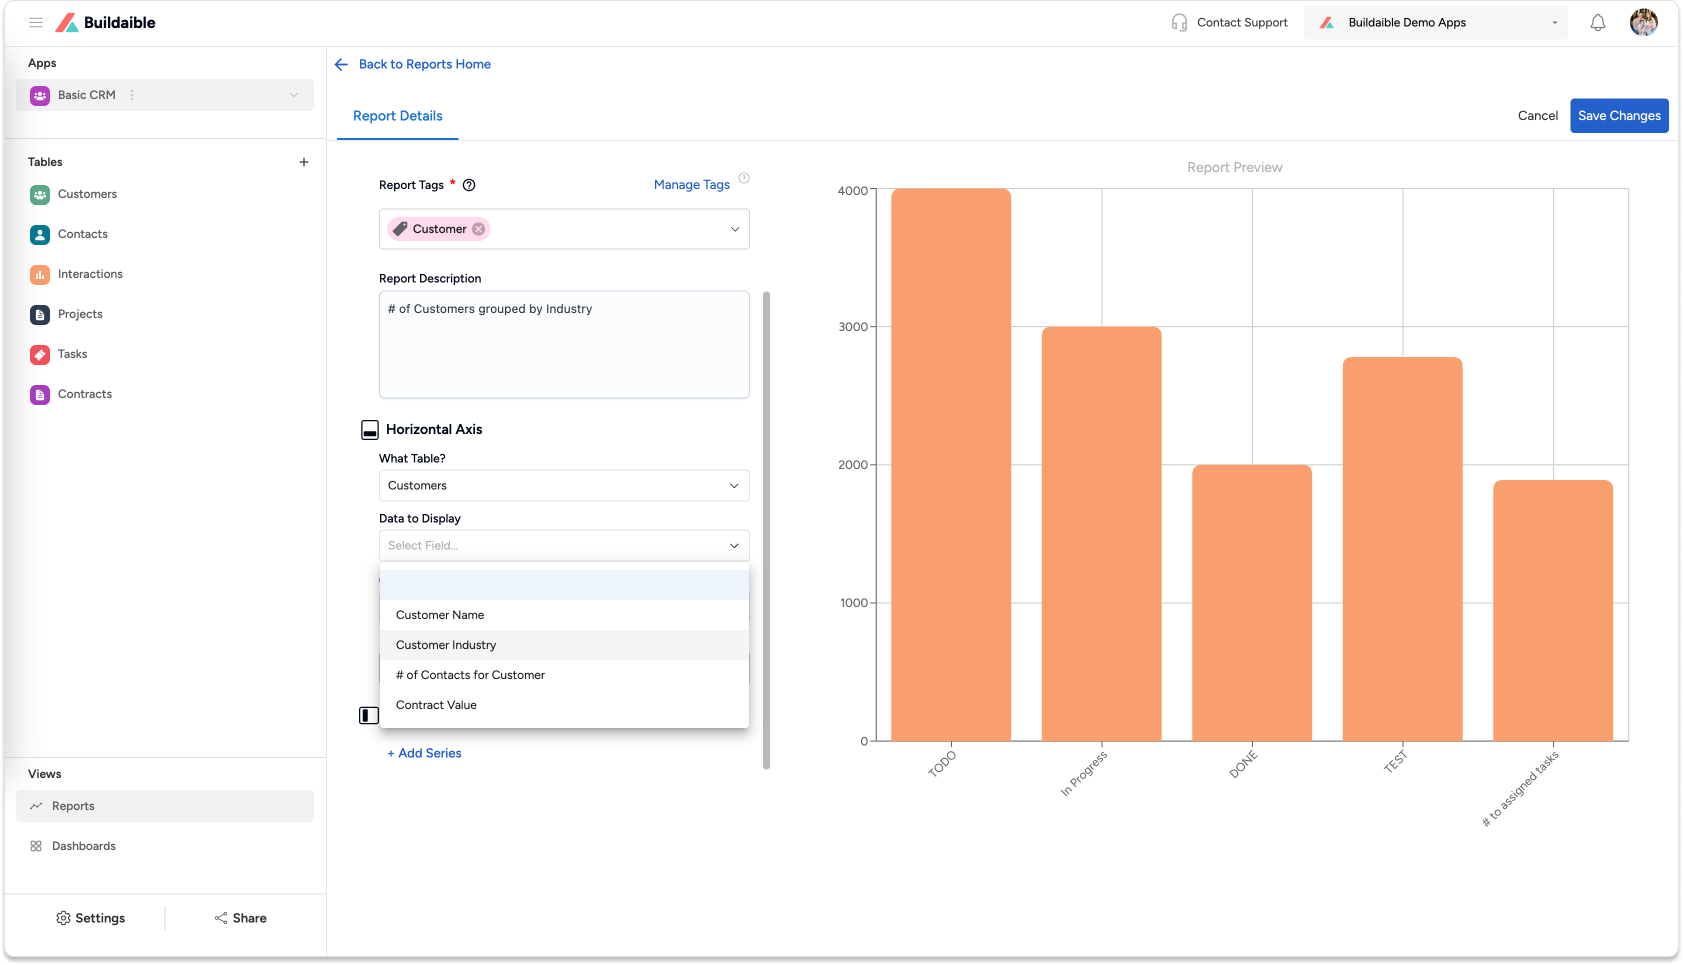
Set Up the Horizontal Axis
The Horizontal Axis determines how data is grouped on the X-axis.-
What Table?: Choose the table containing the data you want to display (e.g., “Tasks,” “Projects,” or “Sales Data”).
-
Data to Display: Select the field you want to group by.
Examples:-
Task Status (TODO, In Progress, Done).
-
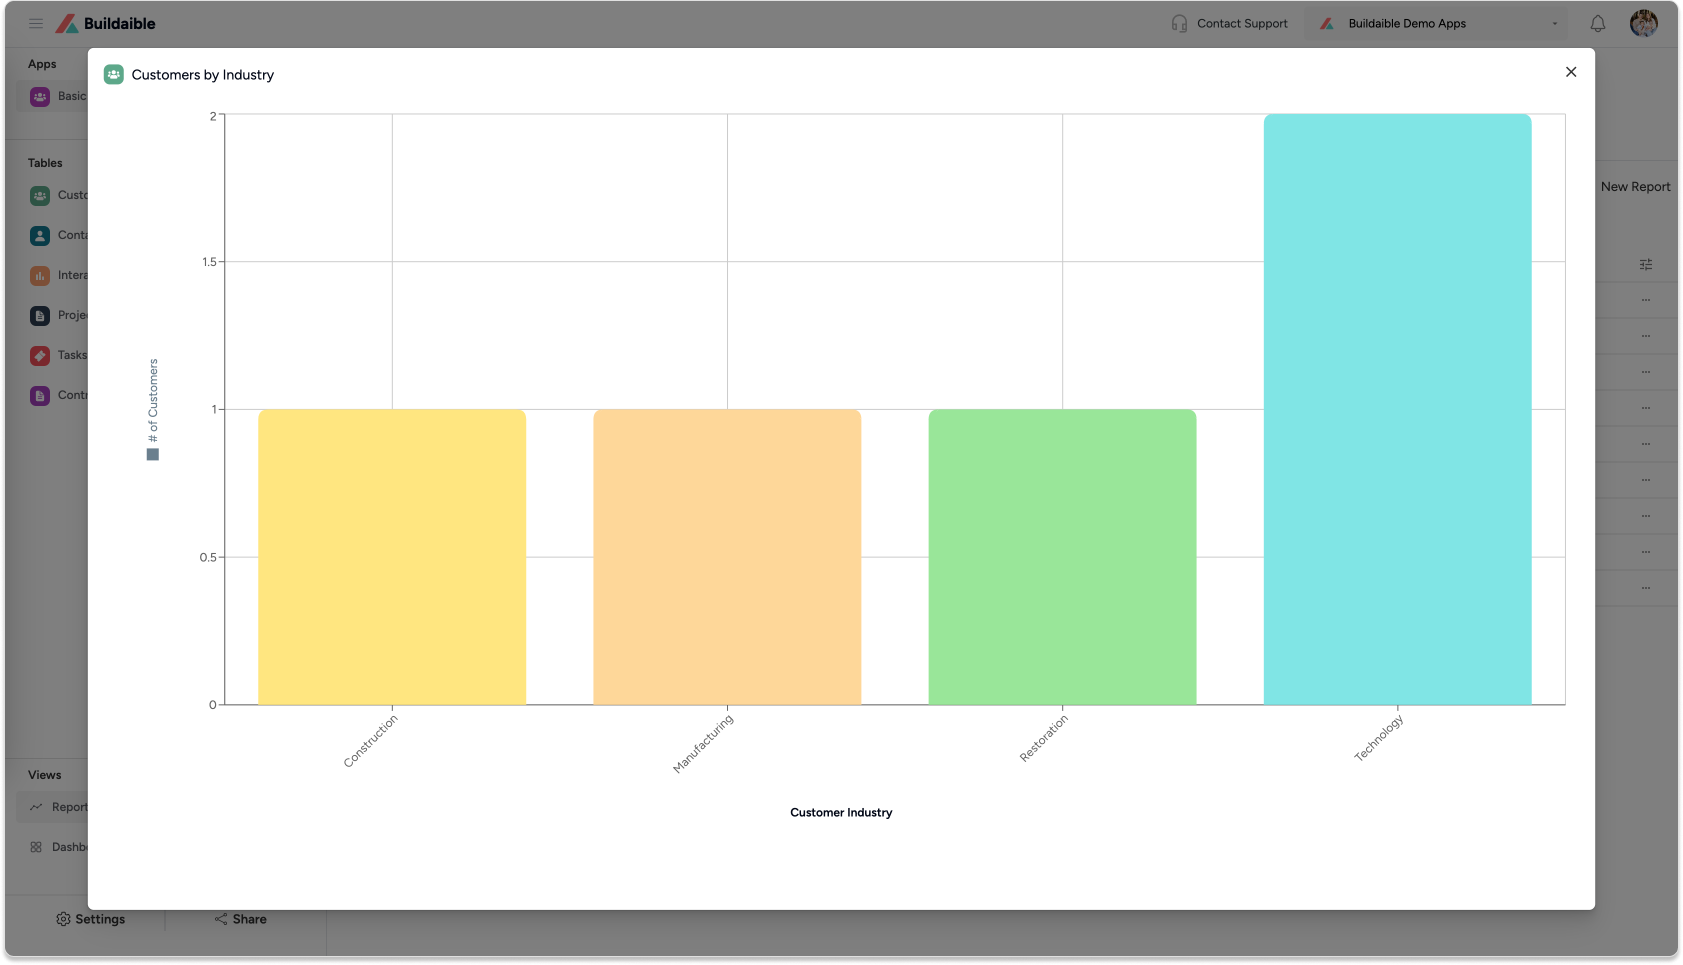
Customer Industry (Marketing, Education, Healthcare).
-
-
Grouping: Set how the data is grouped. Options include Equal Values (default).
-
Display Name: Optionally customize the name displayed for the axis.
.png)
-
-
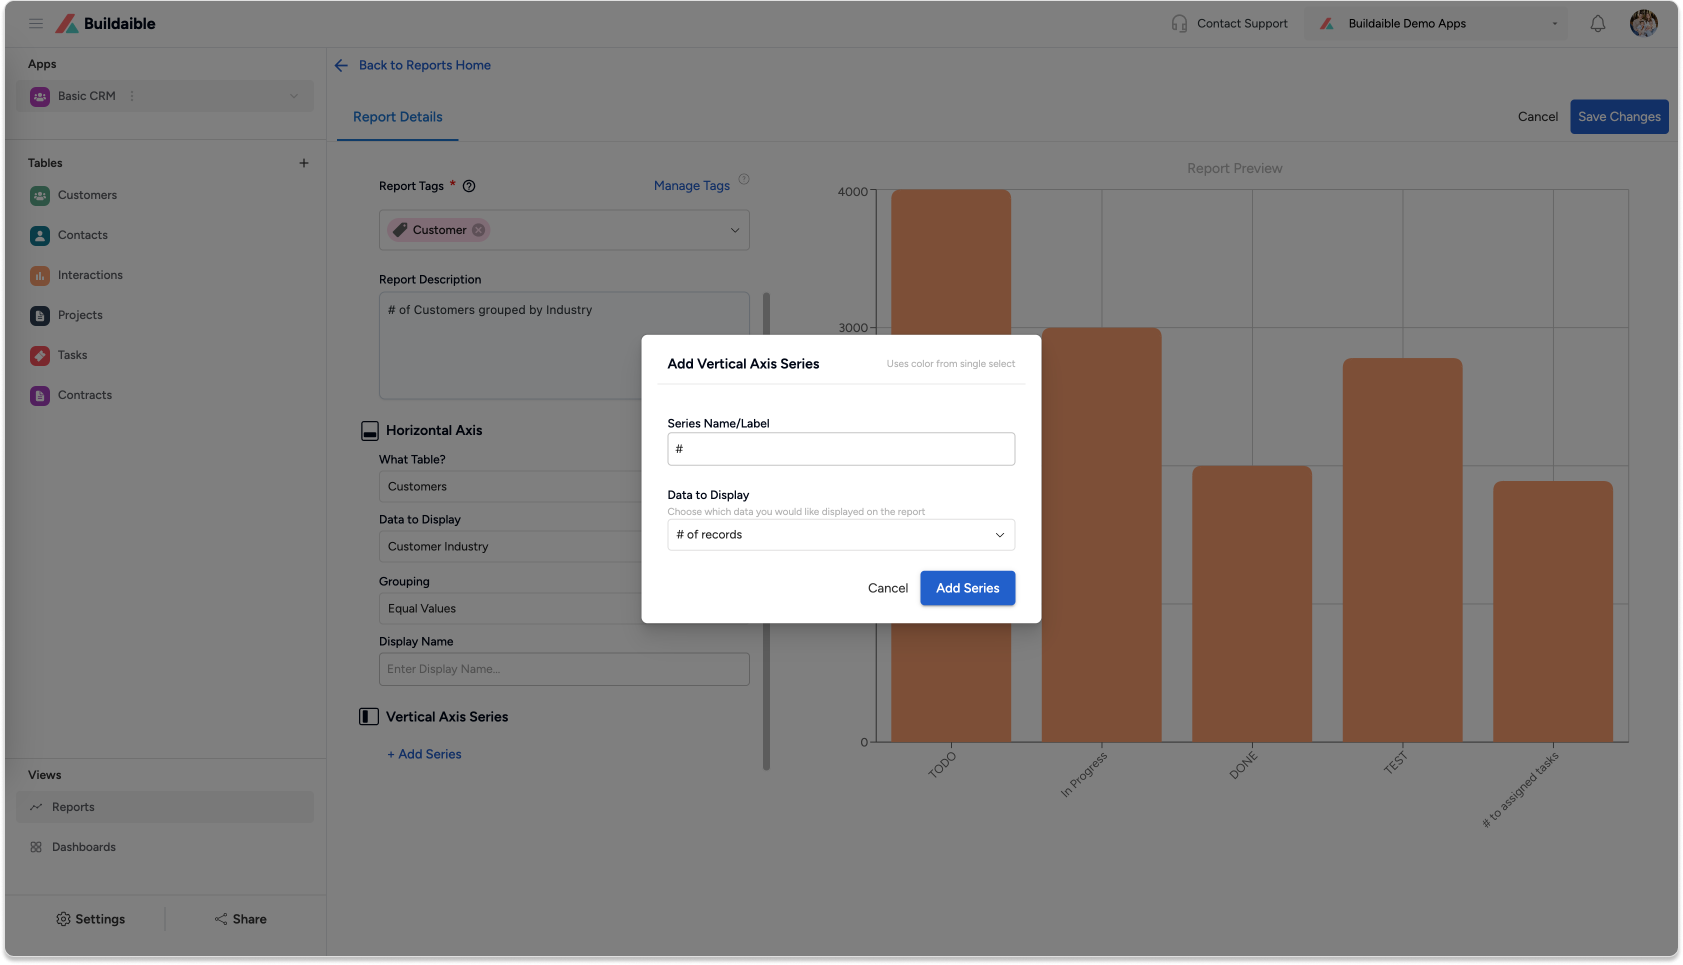
Add a Vertical Axis Series
The Vertical Axis determines the values being measured for each group on the X-axis.
Follow these steps to add a series:-
Under Vertical Axis Series, click “+ Add Series.”
-
In the Add Vertical Axis Series pop-up:
-
Series Name/Label: Enter a name for the series (e.g., “Number of Tasks” or “Total Sales”).
-
Data to Display: Choose the field to measure (e.g., Task ID, Sales Amount).
-
Summarize By: Choose how the data should be calculated—Count, Sum, or Average.
-
-
Colorize the Series: Click the dropper icon in the top-right corner of the pop-up to select a color for the series. This helps visually distinguish between multiple series on the chart.
-
Click “Add Series” to save the series.
Examples:
-
Group tasks by Status (X-axis) and summarize by the number of tasks (Y-axis).
-
Group sales by Region (X-axis) and summarize by total sales revenue (Y-axis).
-
-
-
Save the Bar Chart
Once you’re satisfied with the configuration:-
Click “Save Changes” in the top-right corner.
-
Your Bar Chart will now appear in the Reports list and can be added to dashboards.
-
Key Features of Bar Charts in Buildaible
-
Horizontal Axis Grouping: Easily group data by any table field.
-
Vertical Axis Series: Add one or more series to summarize data with SUM or AVERAGE calculations.
-
Dynamic Report Preview: See real-time updates as you adjust the chart settings.
-
Custom Axis Labels: Rename the horizontal and vertical axes for clarity.
Next Steps
Now that your Bar Chart is ready, you can:
-
Add It to a Dashboard: Learn How to Create a Dashboard
-
Explore Other Report Types: Explore Report Types
-
Refine Your Data: Adjust the table, filters, or fields to further customize your report.
By creating Bar Charts in Buildaible, you can quickly identify trends, measure progress, and make data-driven decisions.