Funnel Charts
Funnel Charts in Buildaible are perfect for visualizing stages in a process, such as sales pipelines, task workflows, or lead conversion funnels. They help you quickly identify drop-offs or progress across stages.
This guide will take you through the steps to create and customize Funnel Charts.
-
Access the Reports Page
-
Open the app where you want to create the Funnel Chart.
-
In the Left Sidebar, under Views, click “Reports.”
-
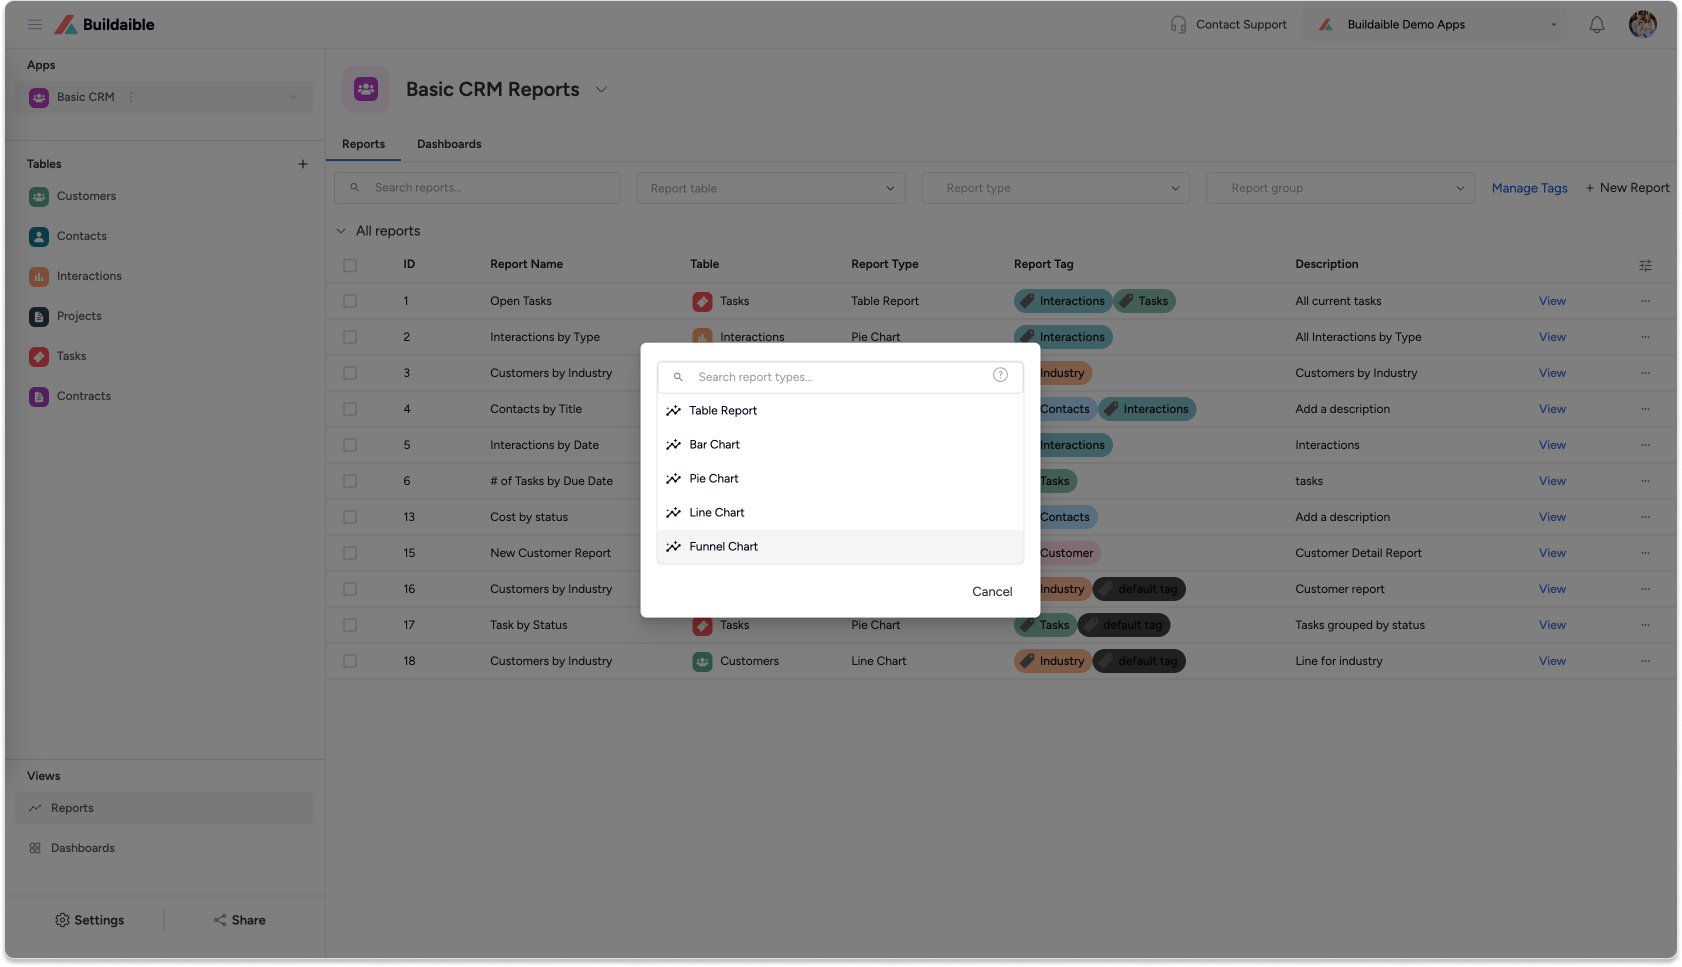
On the Reports page, click the “+ New Report” button.
-
In the pop-up, select “Funnel Chart” as the report type.
-
-
Configure Report Details
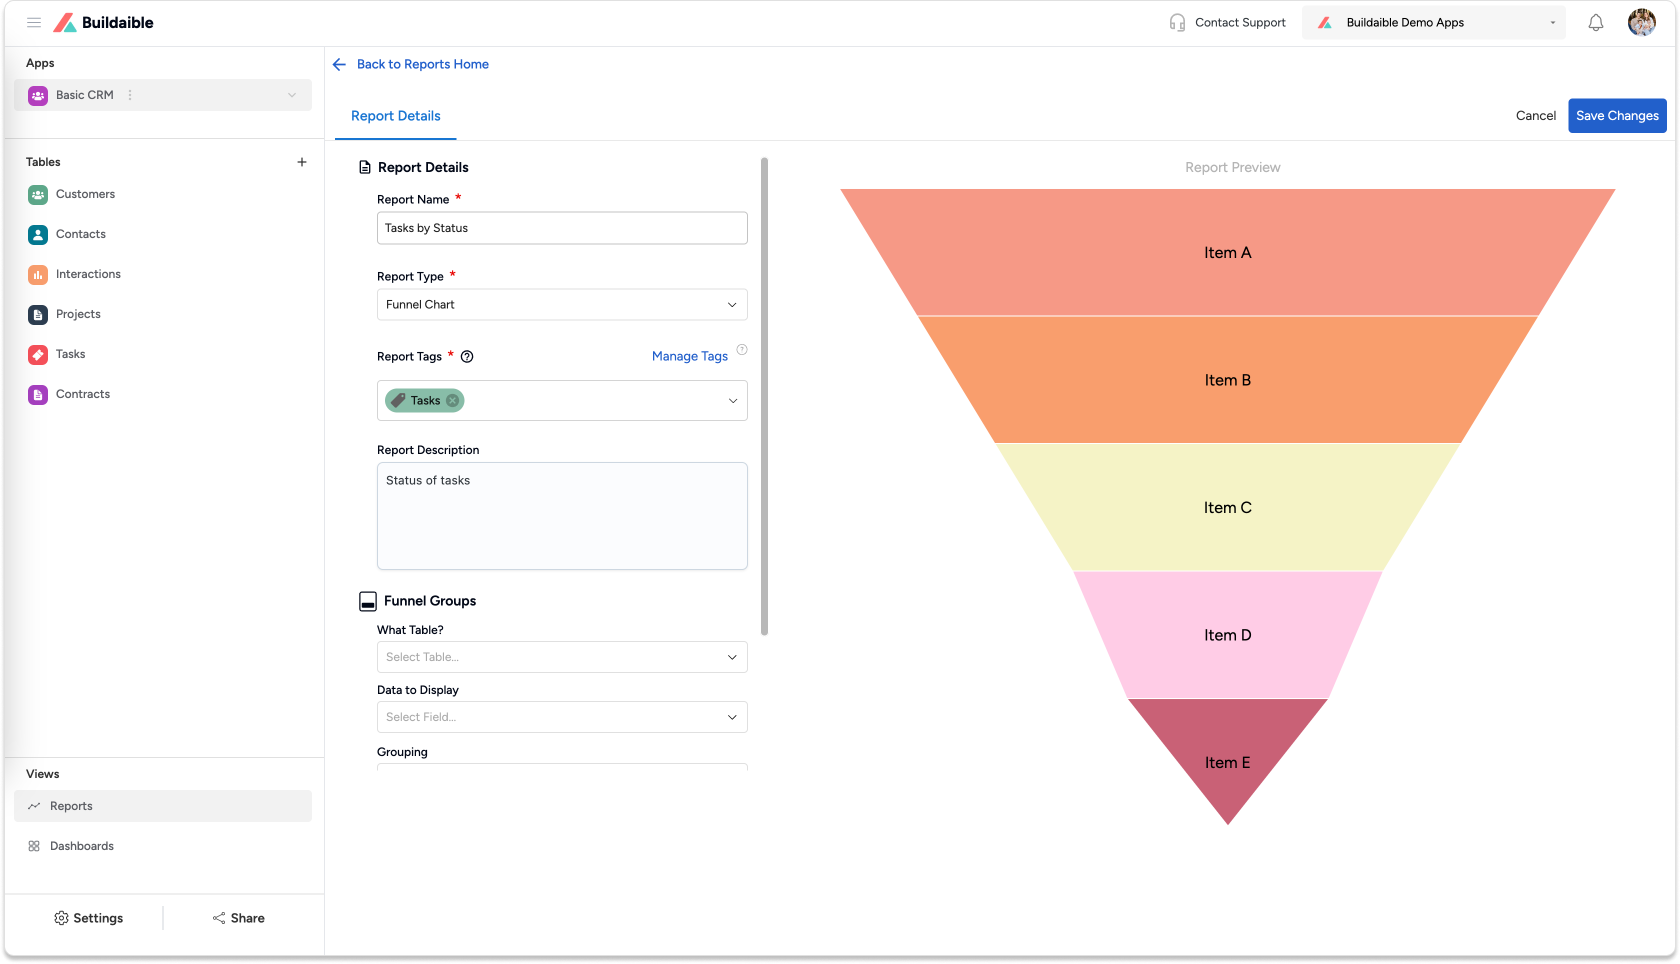
In the Funnel Chart Editor, start by filling in the report details:-
Report Name: Add a descriptive title for the chart (e.g., “Lead Conversion Funnel” or “Project Stages”).
-
Report Tags (optional): Use tags to categorize and organize reports.
-
Report Description (optional): Provide context for the chart.
-
-
Set Up Funnel Groups
The Funnel Groups section defines the stages or categories that make up the funnel.-
What Table?: Choose the table containing the data for your chart.
Example: “Sales Leads,” “Tasks,” or “Project Pipeline.”
-
Data to Display: Select the field to group your data by (e.g., Status, Stage, or Category).
-
Grouping: Use Equal Values to group identical values together.
-
Display Name (optional): Rename the axis label for clarity.
Example Use Case: Group tasks by Stage (e.g., To Do, In Progress, Done) to visualize workflow progress.
.png)
-
-
-
Add Funnel Data (Add Series)
To add data to your Funnel Chart:-
Under Funnel Data, click “+ Add Series.”
-
In the Add Funnel Data pop-up:
-
Series Name/Label: Give the series a name (e.g., “Lead Count” or “Task Count”).
-
Data to Display: Choose the field to measure (e.g., Lead ID, Task ID).
-
Summarize By: Select Sum or Average to determine how the values are calculated.
-
-
Click “Add Series” to save the series.
Example Use Case: Summarize the number of leads in each stage of a sales pipeline.
.png)
-
-
Save the Funnel Chart
Once you’re happy with the chart:-
Click “Save Changes” in the top-right corner.
-
The new Funnel Chart will now appear in your Reports list.
.png)
-
Key Features of Funnel Charts in Buildaible
-
Customizable Stages: Define stages based on table fields like status or workflow stages.
-
Summarization: Visualize totals or averages at each stage.
-
Real-Time Preview: Instantly see updates as you configure the chart.
-
Progress Visualization: Clearly identify drop-offs or progress through stages.
Next Steps
Now that your Bar Chart is ready, you can:
-
Add It to a Dashboard: Learn How to Create a Dashboard
-
Explore Other Report Types: Explore Report Types
-
Refine Your Data: Adjust the table, filters, or fields to further customize your report.
By using Funnel Charts in Buildaible, you can gain clear insights into workflows, sales pipelines, or other processes with multiple stages.